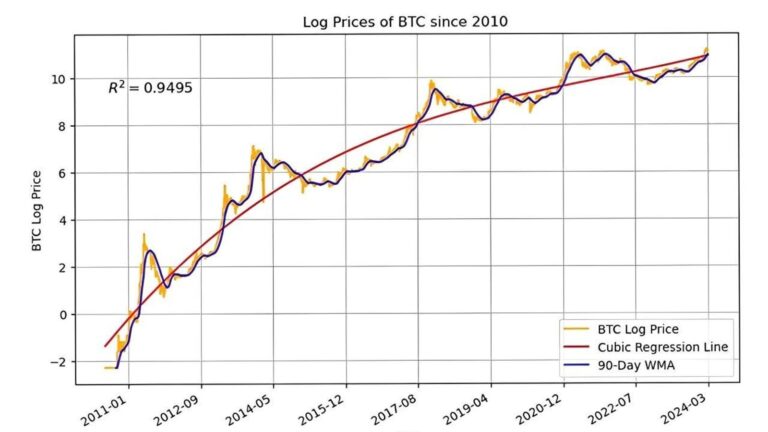
What would happen if Bitcoin continued on its current near-exponential growth trajectory? To put this into perspective, let’s consider a logarithmic chart of the Bitcoin price and try to predict the future. I call this approach an exponential model because it takes the natural logarithm of the Bitcoin price and applies an exponential operator to back-calculate the predicted price. Logarithms are tools that help linearize exponential phenomena, and the price of Bitcoin is an example of such a phenomenon. An exponentially growing phenomenon looks approximately linear in logarithmic space, so its graph looks like this:
BTC price since 2010
Bitcoin.com Principles
Data runs over the past 13 years. The orange line is the logarithm of the Bitcoin price, the black line is the 90-day weighted moving average (WMA) of the recorded Bitcoin price, and the red line is the best-fit curve. The purpose of the moving average is to smooth out short-term fluctuations in the Bitcoin price and highlight some of the longer cycles.
To fit the curve, we found the best cubic equation to fit the data. The decision to settle on a cubic rather than a quadratic function, or even a higher order polynomial, is somewhat arbitrary. In fact, you can always overfit your data using higher order polynomials. The problem is that while the in-sample predictions are very high, the out-of-sample predictions are questionable. Cubic functions are slightly more flexible than quadratic functions, but not as much as anyone would believe. Finally, the goodness of fit of 0.9492 is very tight, with 1 being a perfect fit.


